US Natural Gas Prices: "The
Fix is Underway"
Posted by Gail the Actuary on April 22, 2009 -
10:26am
Topic: Supply/Production
Tags: drilling rigs, jon freise, natural gas [list all tags]
[From http://www.theoildrum.com/node/5323#more]
This is a
guest post by Jon Freise. Jon has written several
previous guest posts related to natural gas.
"The fix is underway"
says Chesapeake Energy in their April Investor Presentation. What they mean is
that natural gas prices are going back up this winter. The number of rigs
drilling for natural gas is going down. Fewer rigs means
fewer new wells and eventually less natural gas and higher prices for
consumers.
This is the third article
investigating the possibility of a spike in natural gas prices during early
2010. In this article we look at the scenarios
Quick Summary
As a kindness to
those who are busy planting tomatoes and just want to know if they should order
wood pellets for next winter, here is the quick version: The number of rigs has
already fallen enough to cause natural gas prices to rise next winter:
"CHK sees
We don't yet know if drilling
will be cut back enough to cause a spike into a higher $12-$13 mmcf range (like prices did in 2005 after Hurricanes
Katrina and Rita).
The Spike-Dip-Spike Pattern
The last 10 years
have shown a repeating pattern of natural gas price spikes and dips (covered in
more detail in Anatomy of a
Natural Gas Price Spike).
The reason for
this repeating cycle is that price dips cause reductions in the number of wells
drilled. Those reductions cut the flow of natural gas until a shortage
develops. Prices then spike as consumers compete for too little natural gas.
High prices cause users to cut
back on natural gas purchases and encourage more wells to be drilled.
Eventually these cause an excess of natural gas and prices fall into another
dip, setting up the next spike and repeating the pattern.
We are currently experiencing a
dip after the 2008 price spike. (Just past arrow 5 in Figure 2). The current
well head price for natural gas is far below the average producing cost,
meaning that most natural gas producers cannot make a profit at these natural
gas prices, and for this reason they are drastically cutting back the number of
drilling rigs.
Balancing the Market
The question is
how many rigs must be cut back to balance the market? And what further cut in
rig numbers would cause a price spike?
2008
2008 natural gas rig count
averaged ~1,500 rigs - this overcame first year depletion of ~25% and generated
growth of ~7%, for a combined ~32% addition rate
If natural gas rig count went
to zero, then all would agree this ~32% number would also become zero
So, if natural gas rig count
goes down by 50% in 2009, CHK believes industry will lose nearly 40% of this
~32% production capacity increase, through which ~7% growth disappears and ~7%
production declines appear by 2010.
So, YOY growth of ~4 bcf/day in 2008 will soon
give way to a decrease of ~4 bcf/day, setting up a
big price rebound in 2010 and 2011 if
Figure 3: Decline Rate and Production Increases
Source: Chesapeake Energy
-Click to Enlarge
A 50% decline in
rigs only causes a 40% decline in new adds. So they
are factoring in that the most productive wells survive the price dip and the
least economic wells do not.
Figure 4 shows
that if the rig count drops to 750 (CHK's most likely
case) that
Here I have added a red bar that
allows easy comparison of when supply has fallen to or below
53 bcf/d in the last 8 years.
Figure 5: Past periods of low production
Source: Chesapeake Energy
-Click to Enlarge
A chart of price
spikes has been provided as Figure 2. The dip below the red bar in 2002 caused
the price spike in 2003. But the dip in 2004 did not cause a spike, but the
deep fall in 2005 did (that was Hurricanes Katrina and Rita).
Current US
Baker Hughes
reported the gas directed rig count was 760 on April 17, down 30 from the prior
week.
Johnson and Rice Co pointed out
that the most productive rigs are shale gas rigs (discussed in Natural Gas Supply and Demand
Balance). Those are mostly horizontal rigs, and Baker Hughes reports that
the number of horizontals dropped by 11.
Where will the rig count end up?
The last week showed a drop of 30 gas intent rigs. Does this mean that we are
no where near bottom yet?
Smith Bits also keeps rig counts
and they track how many rigs are setting up or tearing down. The totals for
this week were 38 gas rigs setting up and 56 tearing down. We can expect the
rig count to continue falling.
If those rigs do come down next
week then we will have passed the 750 rig balancing point for the market and
prices should recover early 2010, assuming
Contributing Factors
Johnson and Rice
Co provided a list of additional factors that will adjust the supply/demand
balance:
Avg. LNG Import Increase: 0.5 Bcf/d
Avg. U.S. to Mexico Export Drop: 0.5 Bcf/d
Remaining Industrial Demand Drop: 1.0 Bcf/d
Canadian Import Drop -0.9 Bcf/d
GOM Production Return 0.9 Bcf/d
Steepened Decline Curve Effect: -1.3 Bcf/d
We are going to take a look at
the steepened decline curve, the industrial demand drop, and add to this list:
curtailments of current production.
US Decline Rate
Figure 6: US Decline Rate vs Year
Source: Chesapeake Energy
-Click to Enlarge
What is
fascinating about this chart is that while both base decline and first year
decline tend to bounce around, they both trend slightly down in value. Is this
the data that CERA is using as the basis of their claim that unconventional gas
lowers decline rates?
From the CERA Press Release:
"Technology Drives North American Gas Renaissance:"
"Given the increased
productivity of unconventional wells, the study concludes that it is not
necessary to increase drilling activity to maintain - or increase - production.
After years of developing unconventional gas with its long-lived production, in
the aggregate, the average decline rate will fall. This means, the study says,
that a smaller quantity of new production is required to offset natural
production declines."
This is in direct contradiction
of JRCO which has said "We believe that the aggregate
I must admit it is very hard to
understand how unconventional wells with a first year decline rate of 60% or
greater can push the national decline rate lower.
Figure 7 shows an earlier
analysis by EOG Energy using IHS data. That analysis agrees with JRCO and
projected a slowly increasing

Figure 7: EOG Energy US Decline Rate vs Year
Source: EOG Energy
-Click to Enlarge
Thank you to
Seeking Alpha for Figure
7.
One possible explanation is that
the sheer number of new wells drilled has created a low decline rate cushion.
You can see from Figure 8 that wells begin with a high decline level and slowly
fall to a lower and lower rate over time (producing less and less gas however).
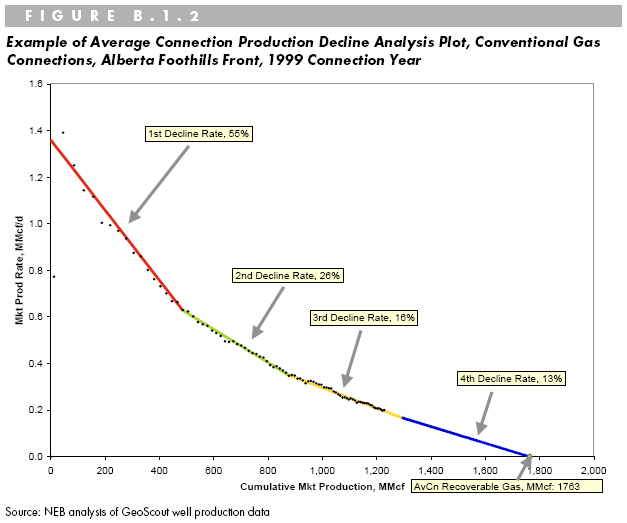
The national
decline rate should end up somewhere between the first and last decline rate
values. Unfortunately, I don't have the IHS database and we cannot investigate
the basis of CERA's claim further.
In any case, if these more
pessimistic estimates of the base decline rate are correct, then a drop to 750
drilling rigs will over correct the market into a supply shortage.
Industrial Demand
With GM declaring
bankruptcy and many other manufacturers shutting down, it is critical to
include some estimate of the falling demand for natural gas in the industrial
sector.
JRCO found that industrial
utilization and natural gas usage were tightly correlated and that historically
a 1% drop in industrial utilization caused a 1% drop in industrial natural gas
demand.
JRCO provided Figure 9 showing
GDP and Industrial Utilization. I updated the chart with the April 15th Federal
Reserve Statistical Release on Industrial
Production and Capacity.
Industrial Capacity has fallen to
69.3%, which is a new historical low since data collection began in 1948 and
11.7 percent since first quarter 2008.

Figure 9: Industrial Capacity Utilization
Source: Johnson & Rice Co
-Click to Enlarge
JRCO provided 18.2 bdf/d as the Industrial natural gas
demand at the start of the recession. They project a total 15% drop in
industrial utilization during this recession for a total natural gas demand
reduction of 18.2 * 0.15 = 2.7 bcf/d
JRCO also offered the very interesting
Figure 10 on the history of Industrial Utilization.
Figure 10: History of Industrial Capacity Utilization
Source: Johnson & Rice Co
-Click to Enlarge
JRCO makes the
point that some lost industrial capacity (and thus natural gas demand) will be
gone forever. What I find interesting is how long it takes for industrial
capacity to climb back after a recession. It took the whole decade of the 80's
to recover from the Iranian Revolution and Iran-Iraq war.
James Hamilton made
the argument that the 2008 oil price spike was enough to cause the current
recession. Counter arguments have been stated that if the oil prices caused the
recession, why didn't demand spring back after prices fell? I think it is clear
from this Industrial Capacity History chart that it takes a long time for
demand to recover.
Curtailed Production
Another factor
which could cut short a price spike is that gas companies may have wells they
have shut in and are not producing. They will turns these wells on as prices
rise allowing a rapid flood of natural gas to enter the market much faster than
an increase in drilling could respond.
Here is a statement from a
Chesapeake Energy press release:
OKLAHOMA
CITY--(BUSINESS WIRE)--Apr. 16, 2009-- Chesapeake Energy Corporation (NYSE:CHK)
today announced it has elected to curtail approximately 400 million cubic feet
(mmcf) per day of its gross natural gas production
due to continued low wellhead prices. The reduction includes the 200 mmcf per day curtailment of natural gas production
previously announced on March 2, 2009.
Oil Drum posters have been
skeptical about how much production has really been shut in, given the cash
flow needs of these companies. However, assuming the production has been shut
in and other natural gas companies have followed suite, then there could be a bcf/d or more of natural gas production waiting to turn
back on for high oil prices.
It is also likely that if storage
reaches capacity there will be no choice but to shut in some production.
Such a development would be
welcomed by consumers, as it would moderate any chance of a price spike even if
the fall in rig count over corrects the market.
EIA Short Term Outlook
The EIA short term outlook predicts a modest
price recovery in 2010. They do not see a large shortfall developing due to a
drop in drilling.
Total consumption
of natural gas is projected to fall by nearly 2 percent in 2009, leading to
lower natural gas prices. Industrial natural gas consumption is expected to
decline by more than 7 percent, as industrial production declines during the
current economic downturn. However, natural gas consumption in the electric
power sector is projected to increase by almost 1 percent, since the lower natural
gas prices will back out some coal consumption in this sector. The Henry Hub
natural gas spot price is projected to decline from an average of $9.13 per
thousand cubic feet (Mcf) in 2008 to $4.24 per Mcf in 2009, then increase in 2010 to an average of more
than $5.80 per Mcf.
The 1% increase in electrical
generation demand for gas is about 0.17 bcf/d,
which is not tiny but should be small compared to the other larger factors.
More importantly, the EIA expects
the
Conclusion
The drilling rig
count has fallen to the point where the market should balance in early 2010, if
If a further drop in the rig count
happens or if the decline rate is faster than assumed, then production will
fall well below demand.
Shortfalls in supply will be
moderated because of a continuing decline in the industrial sector that will be
slow to recover and because storage is currently high (and possible shut in
production coming back into production as prices rise).